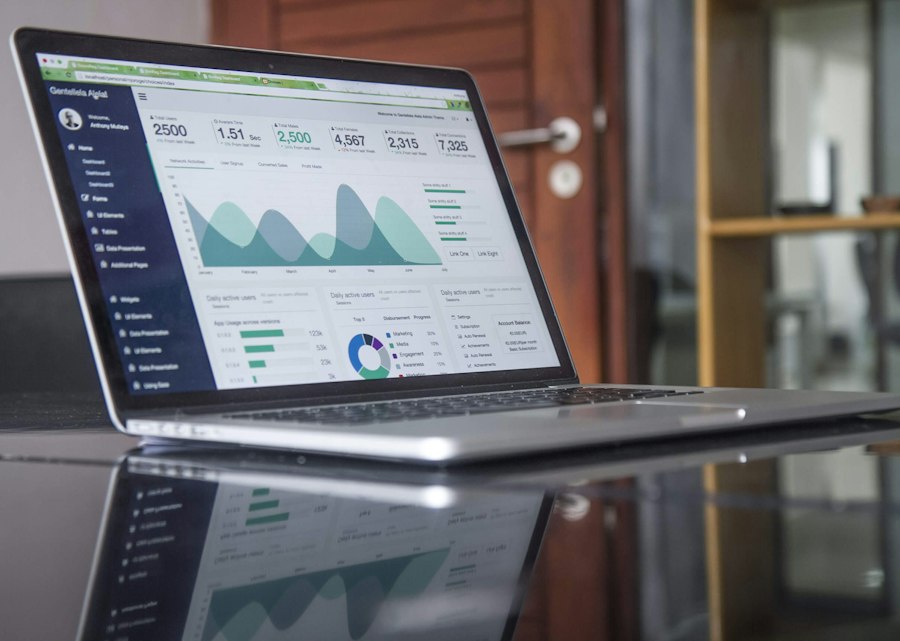
Analyze and compare your buildings

Quickly identify potential energy savings, manage your budget, and compare buildings across your portfolio with data-driven insights.

Energy analytics and benchmarking charts

From raw data to actionable insights

Collecting energy data is only the first step. The real value comes from analysis — understanding where energy is wasted, which buildings underperform, and where the fastest returns on investment lie.

Sentient EMS transforms centralized data into clear visualizations and comparisons, helping facility teams prioritize actions that matter most for cost reduction and sustainability.

Analysis tools built for commercial portfolios

Quick win identification — Spot opportunities like subscribed power optimization and billing vs. metered data discrepancies.

Anomaly detection — Early warning when consumption deviates from expected patterns, before costs spike.

Cross-building comparison — Benchmark properties by size, use type, climate zone, and energy intensity metrics.

Portfolio mapping — Visual overview of all buildings with top and bottom performer rankings.

Time-series analysis — Compare consumption trends year-over-year, season-over-season, and against weather-normalized baselines.

Budget management — Track actual spend against forecasts and identify buildings exceeding energy budgets.

Benchmark with confidence

Comparing buildings fairly requires normalizing for differences in size, occupancy, and climate. Sentient EMS applies standard energy intensity metrics (kWh/sq ft, kWh/occupant) so you can identify true outliers — not just the largest buildings.

Whether you're managing three properties or thirty, the same analytical framework scales to give you portfolio-level clarity without drowning in spreadsheets.

  • Energy Use Intensity (EUI) tracking per building
  • Normalized comparisons across climate zones
  • Exportable analysis for stakeholder presentations
Business team reviewing energy performance data

Continue exploring Sentient EMS